Performance view
Track chiller operating conditions and COP-related trends.
APPLICATION_09 · HVAC
See chiller performance, water-treatment conditions and efficiency signals before they become costly faults.
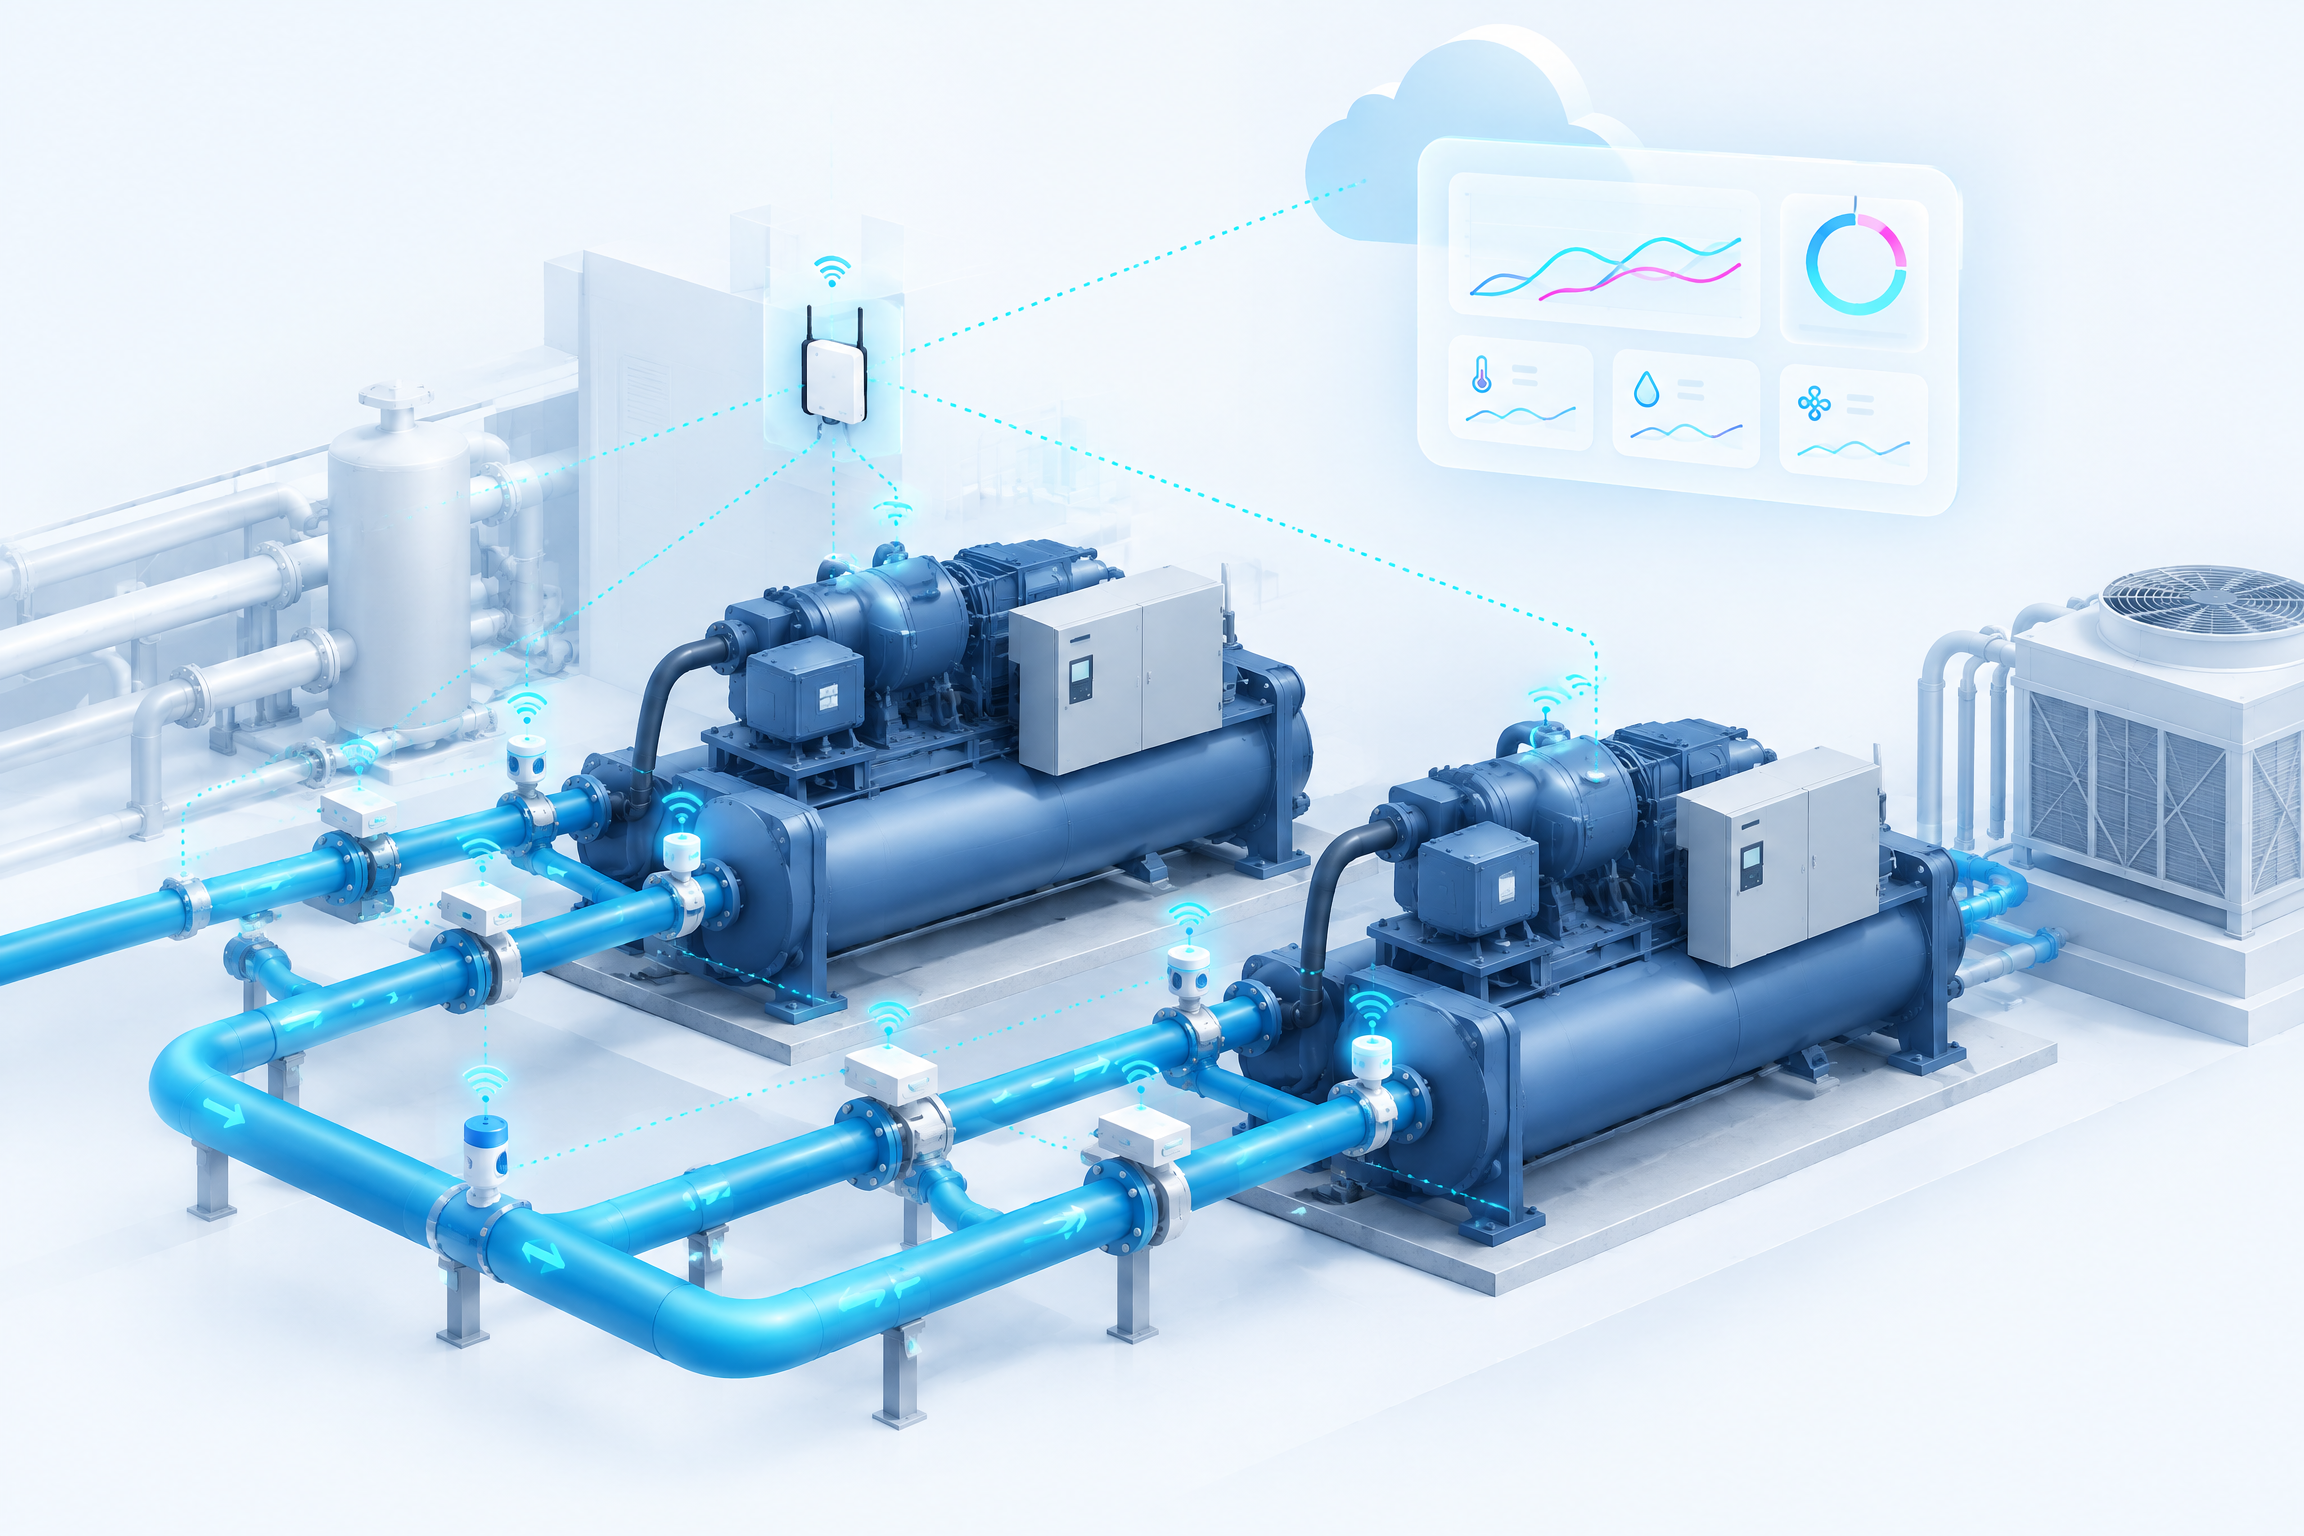
Bring temperature, pressure, runtime, energy and water-treatment data into one dashboard for COP tracking, alerts and maintenance decisions.
At a glance
Track chiller operating conditions and COP-related trends.
Bring water quality and treatment telemetry into the same review process.
Give facilities teams a clear record of exceptions, response and follow-up.
What the solution does
Compare cooling output and operating input to understand efficiency.
Raise alerts for temperature, runtime, pressure or treatment exceptions.
Add sensing without long new cable runs in plant rooms.
Combine live data, trend history and service records for clearer decisions.
Dashboard view
Set roles, thresholds, locations and escalation rules to match your team. Start with the view below, then adjust.
Operating flow
Collect chiller, plant-room and water-treatment signals.
Bring readings into consistent equipment and site views.
Flag exceptions and route them to the responsible team.
Use COP and historical trends to guide maintenance.
Next step
Tell us the building type, floor area, what systems are already installed, and what you need to solve. We will come back with an assessment.
Book a site assessmentFAQ
Capture temperature, flow and power via wireless telemetry and/or existing plant interfaces. Show live COP and trends on a dashboard and alert on drift so maintenance conversations start from performance drop, not only breakdown. Quantified savings percentages need client-sourced figures — we do not invent them.